
Accessing Reports in Blue
Report Types
Each semester, 4 reports will be generated in Blue. Access to each report will depend on your role (e.g., instructor or teaching assistant).
The reports are as follows:
Full Questionnaire: This report includes all responses to all questions (including optional question personalization additions) and comments that were included as part of the questionnaire.
Core Likert Questions: This report includes all numerical data and response frequency tables for the core institutional questions.
Core Signed Comments: This report includes all signed comments from the core institutional questionnaire.
All Likert Questions: This report includes all numerical data and response frequency tables for all questions, including Question Personalization (QP).
Accessing Blue to View Reports
Once reports are available for the previous semester, you will receive an automated email from Student Feedback Admin (sfqadmin@uoguelph.ca). Within this email will be a link to Blue to access your reports.
You can also login to Blue directly by going to https://feedback.uoguelph.ca and signing in using your central login id and password.
Access a Report
Under Reports, ensure you are viewing Current reports. As each semester is completed, the reports from the previous semester will move to Archived.
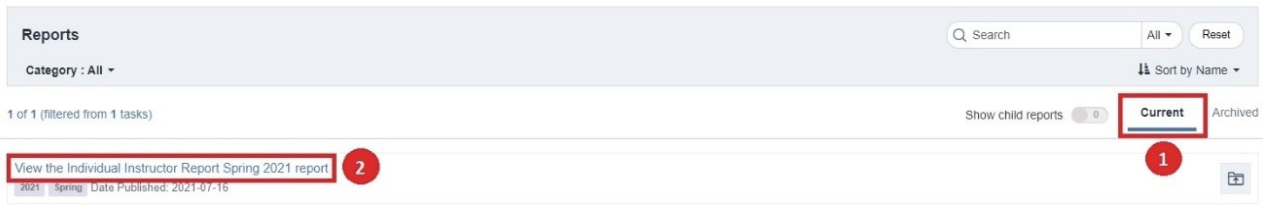
- You will be presented with a list of the available reports. To view a report, click on View the [Report Name] report. For Example, click on View the Full Questionnaire Spring 2021 report
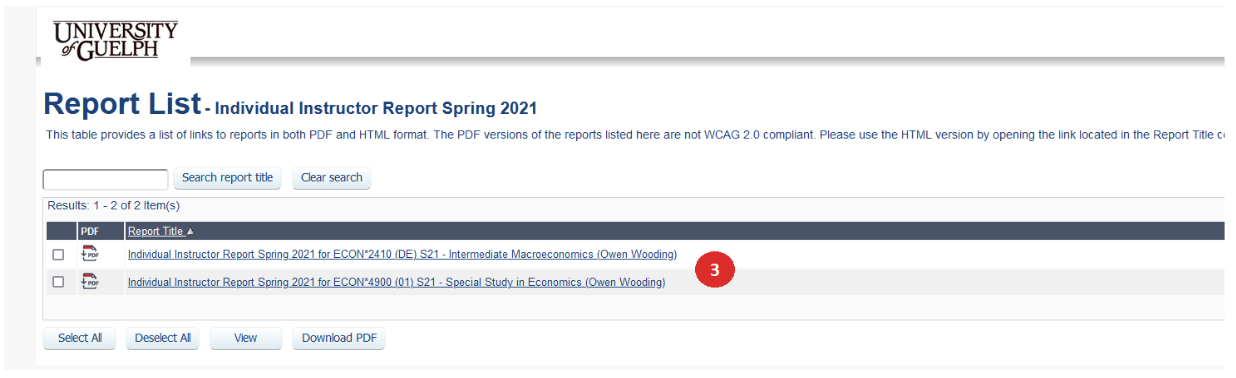
- If you taught multiple courses within a semester, you will be prompted to select the course you wish to view first.
- All reports will show the title of the report including the course code, course name, and instructor/teaching assistant name in the header. Below the title, you will find the number of responses received and response ratio (%).
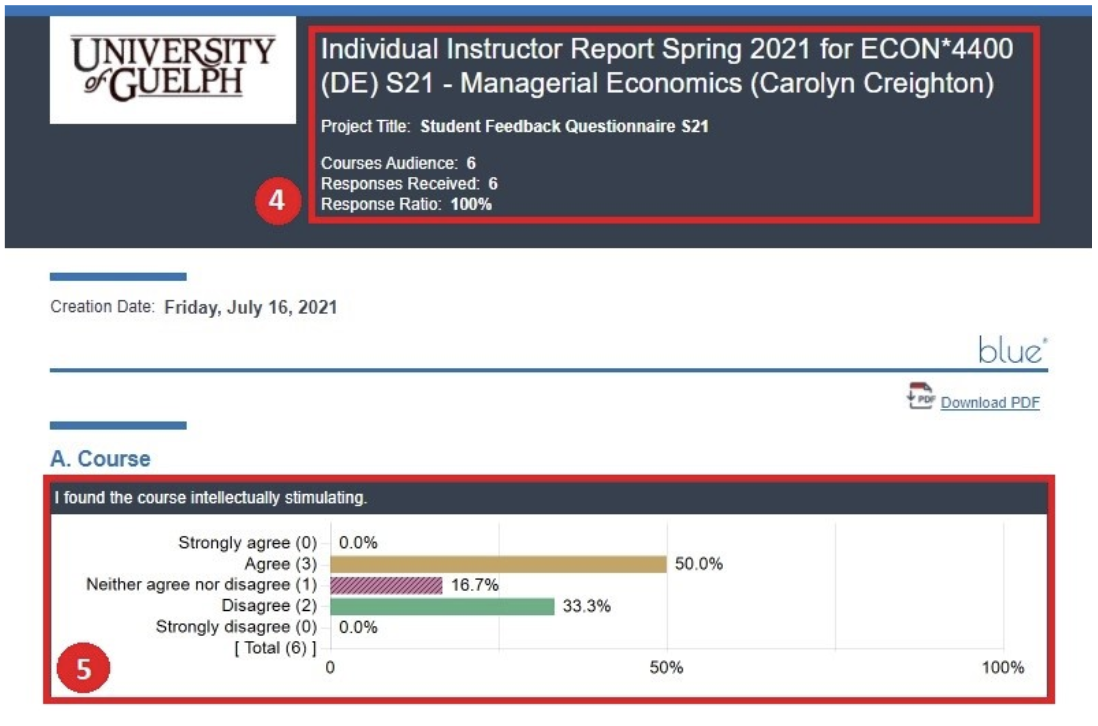
- For all Likert questions, the responses will be displayed as a chart with the total number of responses for each option and response frequency (%).
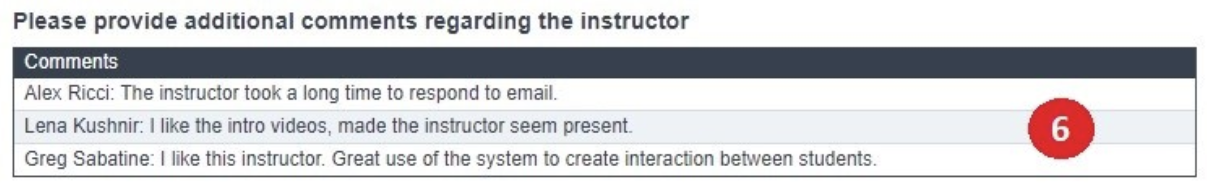
- For all comment boxes, responses will be displayed with or without the name of the commenter.
- The Full Questionnaire report will not display commenter names.
- The Core Signed Comments report will display commenter names as seen below.
Download a Report
If you require a copy of an SFQ report, it can be downloaded from Blue as a PDF.
While viewing the report, click Download PDF found just below the report header on the first page.
Interpreting the Results
More information on how to interpret the results can be found in the following link: https://otl.uoguelph.ca/interpreting-feedback-universitys-student-feedback-questionnaire
I Can't See my SFQ Reports
If you can’t see your blue reports it might be that the SFC might not have mapped it in SFQlink and to contact CourseLink support to confirm if youbelieve it should be there.
(519) 824-4120 x56939 | 1-866-275-1478 (US/CAN)
courselink@uoguelph.ca
211 Day Hall
Need More Help?
If you're still having trouble, please contact the CourseLink Support team for assistance.